Goal

Binary population synthesis (BPS) modelling is a very effective tool to study the evolution and properties of various types of close binary systems. The uncertainty in the parameters of the model and their effect on a population can be tested in a statistical way, which then leads to a deeper understanding of the underlying (sometimes poorly understood) physical processes involved. Several BPS codes exist that have been developed with different philosophies and aims. Although BPS has been very successful for studies of many populations of binary stars, in the particular case of the study of the progenitors of supernovae Type Ia, the predicted rates and ZAMS progenitors vary substantially between different BPS codes.

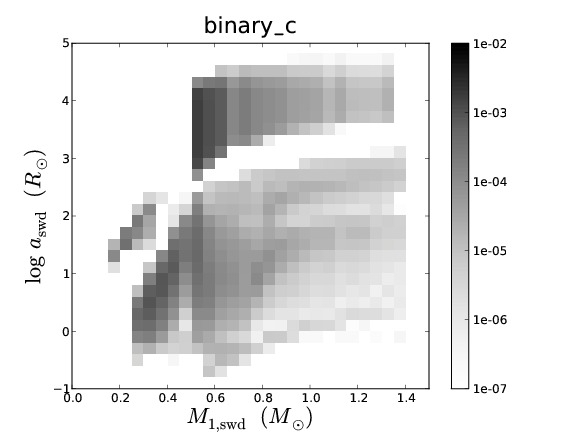
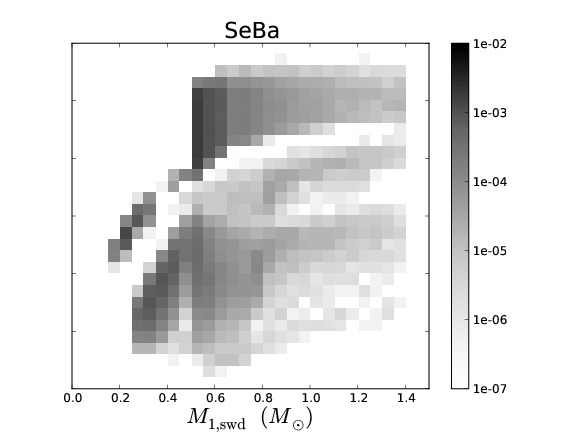
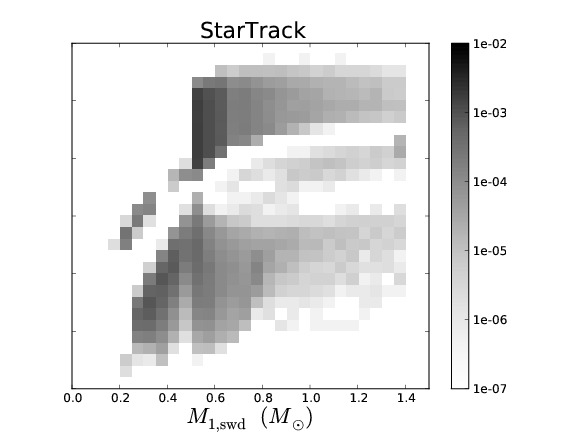
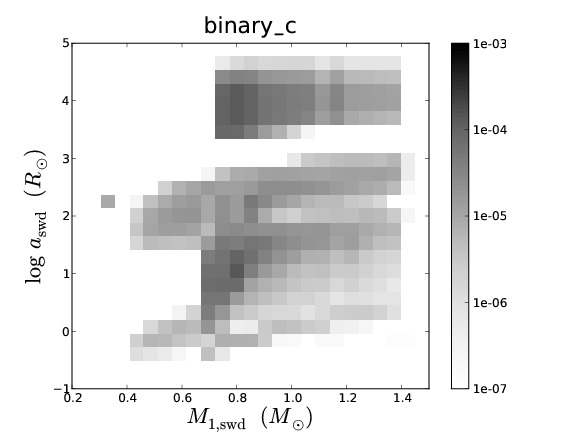
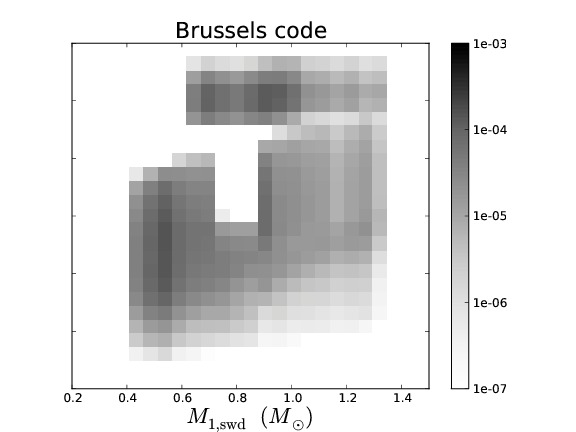
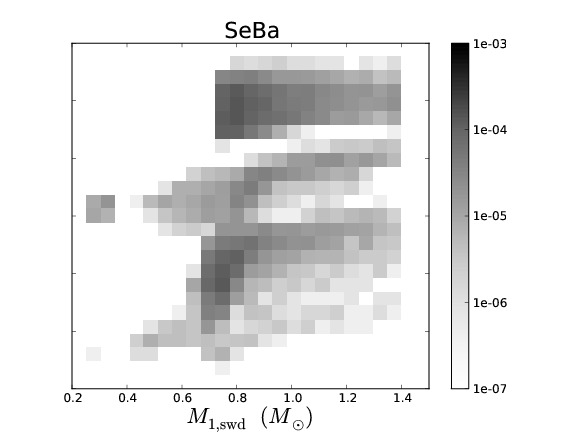
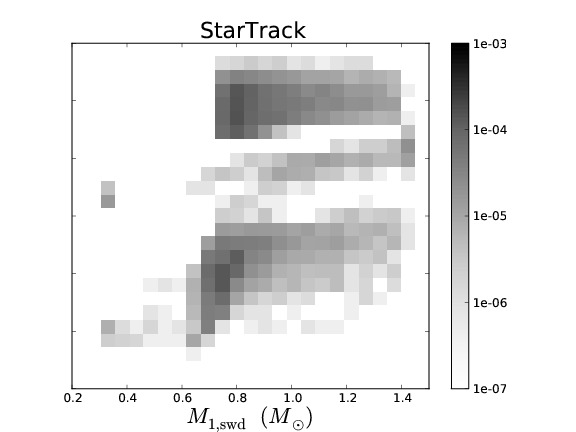
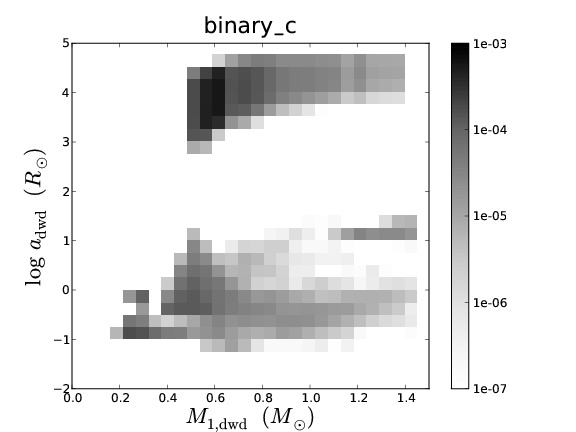
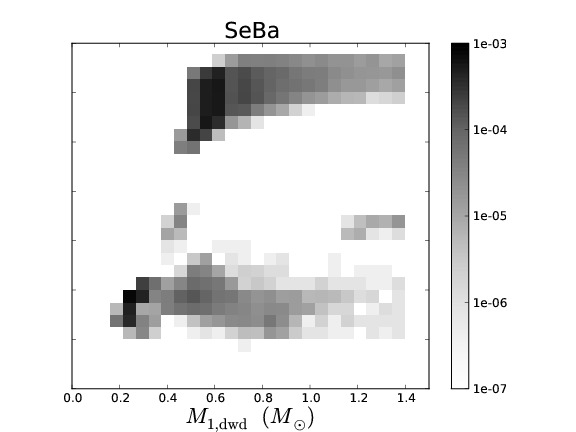
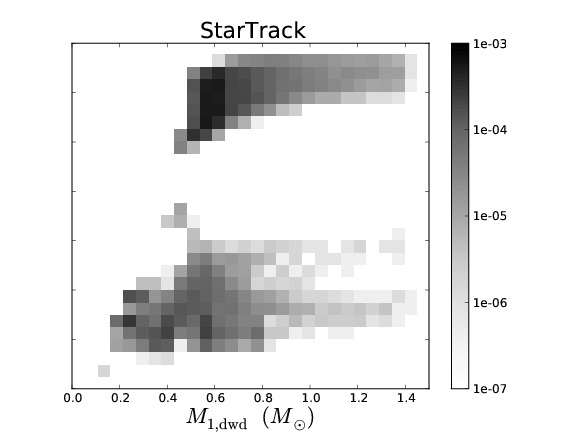
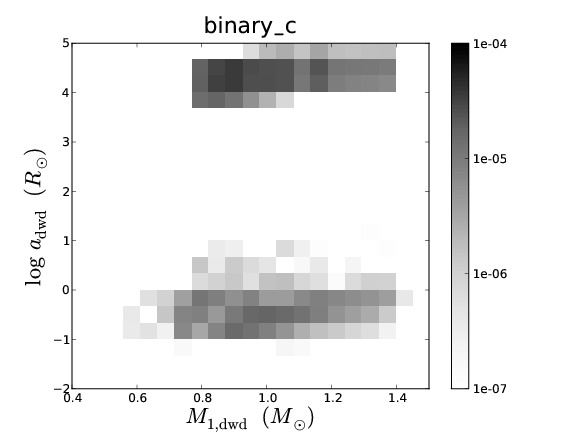
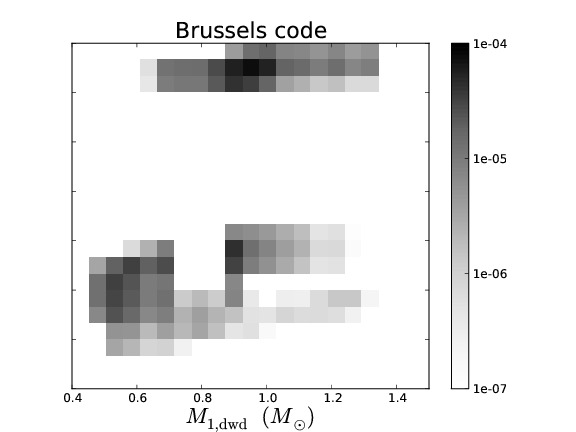
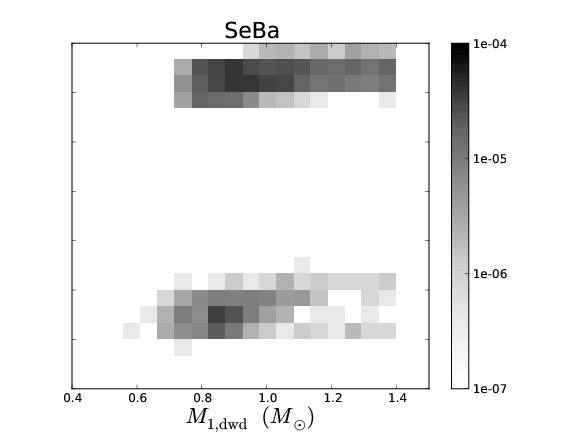
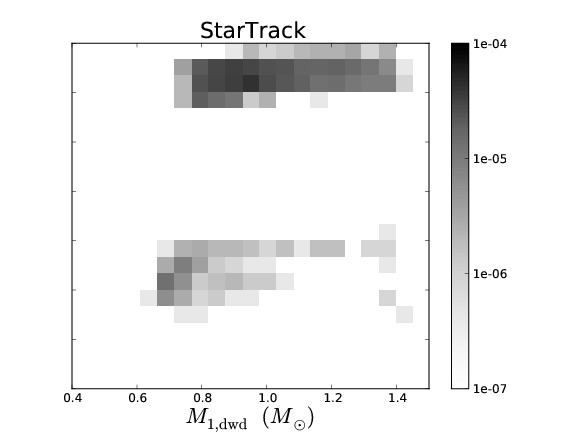
To understand the predictive power of BPS codes, we study the similarities and differences in the predictions of four different BPS codes for low- and intermediate-mass binaries. To simplify the complex problem of comparing BPS codes, we equalise the input assumptions as much as possible. We discuss the similarities and differences in the predicted populations of the different BPS codes. We examine the causes for the differences that remain and in particular whether they are caused by assumptions (that can not be equalized between the codes) or by numerical effects, e.g. a lack of accuracy in BPS codes.


Contact details

Email:
toonen (at) strw.leidenuniv.nl

The codes involved in this project are:
- binary c/nucsyn (binary c for future reference)[Izzard et al.(2004, 2006, 2009), Claeys et al. submitted];
- Brussels code [De Donder & Vanbeveren (2004), Mennekens et al. (2010)];
- SeBa [Portegies Zwart & Verbunt (1996), Nelemans et al. (2001), Toonen et al. (2012, 2013)];
- StarTrack [Belczynski et al.(2002, 2008), Ruiter et al.(2009)].

The paper focuses on low and intermediate mass close binaries, i.e. those with initial stellar masses below 10 Solar masses. We consider two populations of binaries:
- Single WDs with a non-degenerate companion (hydrogen-rich or helium-rich star) (SWDs)
- Double WD systems (DWDs)
Of both populations we investigate the initial distributions and the distributions at the moment that the SWD or DWD system forms.

We distinguish between the `full mass range' and `intermediate mass range', where the latter is defined in the two populations as :
- for the SWD population : WDs originating from initial primary masses higher than 3 Solar masses.
- for the DWD population : WDs originating from initial primary and secondary masses both higher than 3 Solar masses.

The assumptions for the initial distributions and ranges of binary parameters:
- initial primary mass varies between 0.8-10 Solar masses,
- initial mass ratio varies between 0.1/M1,zams and 1,
- initial semi-major axis varies between 5 and 1e4 Solar radii,
- initial eccentricity of 0,
- We consider SWDs and DWDs that are formed within a Hubble time, more specifically 13.7 Gyr,
- initial distribution of primary masses follows Kroupa et al. (1993),
- initial mass ratio distribution is flat,
- initial distribution of the semi-major axis is flat in a logarithmic scale.

In order to compare the codes we make the most simple assumptions:
- mass transfer is conservative during stable RLOF towards all types of objects,
- CE-prescription of Webbink (1984, eq. 3, 4 and 5 in the PopCORN paper) with αλ=1,
- matter lost through winds cannot be accreted by the companion star and is lost with the specific angular momentum of the donor star,
- magnetic braking and tides are not considered.

The assumptions for the normalisation are:
- initial primary mass varies between 0.1 and 100 Solar masses,
- the semi-major axis varies between 5 and 1e6 Solar radii,
- binary fraction of 100%,
- constant star formation rate of 1 Solar mass per year.

Full mass range


Intermediate mass range

Regarding the single white dwarf population, there is a general agreement on what initial parameters of primary mass, secondary mass and orbital separation lead to SWD binaries and which parameters do not lead to SWDs. When the SWD system is formed, there is an agreement on the orbital separation range for those systems having undergone stable or unstable mass transfer. Furthermore there is a general agreement on the stellar masses after a phase of stable or unstable mass transfer and between the populations of the most common evolutionary channels.

Full mass range


Intermediate mass range

Regarding the double white dwarf population, there is an agreement on which primordial binaries lead to DWD systems through stable and unstable mass transfer respectively, and a rough agreement on the orbital characteristics of the DWD population itself. Double white dwarfs go through more phases of evolution than single degenerate systems and therefore the uncertainty in their evolution builds up after each mass transfer phase. The white dwarfs are formed with comparable masses, but at different separations. The most important evolutionary paths leading to DWDs are similar between the BPS codes.

We found that when the input assumptions are equalised as far as possible within the codes, we find very similar populations and birthrates. Differences between the simulated populations are not due to numerical differences, but due to different inherent assumptions. So although the four BPS codes use very different ways to simulate the evolution of these systems, the codes give similar and consistent results and are adequate for studying populations of low- and intermediate mass stars.

Both the equalised (see above) as well as the inherent difference should be taken into account when interpreting results from the BPS codes. The most important inherent assumptions that lead to differences are:
- the MiMf-relations (of single stars),
- the MiMwd-relation (of binary stars),
- the stability of mass transfer,
- the modelling of the mass transfer rate,
- the modelling of helium star evolution.
In Appendix B and C of the paper, a detailed overview is given of the typical assumptions of each code outside the current project. We recommend using these sections as a guideline when deciding which code or results to use for which project.

Finally we would like to encourage other groups involved in BPS simulations, to do the same test as described in this paper and compare the results with the figures given in this paper. More detailed figures can be found here:

SWDs

DWDs

Miscellaneous

If you are using any of these plots, please acknowledge this website (http://www.astro.ru.nl/~silviato/popcorn) and include the following reference: Toonen, Claeys, Mennekens, Ruiter, 2013 accepted by A&A (arXiv:1311.6503).

Last modified: Monday December 23th 2013 Web Site Hit Counters